Key Takeaway — Investors should trim duration exposure in front of a potential Trump victory. This is because policies stated by Trump imply a higher R-Star (neutral rate of interest) with higher risk of inflation, which is bad for the growth factor and duration.
Paul Tudor Jones, a Trump ally, said this morning on CNBC: “All roads lead to inflation. I’m long gold. I’m long Bitcoin. I own zero fixed income. The playbook to get out of this [debt problem] is that you inflate your way out.”
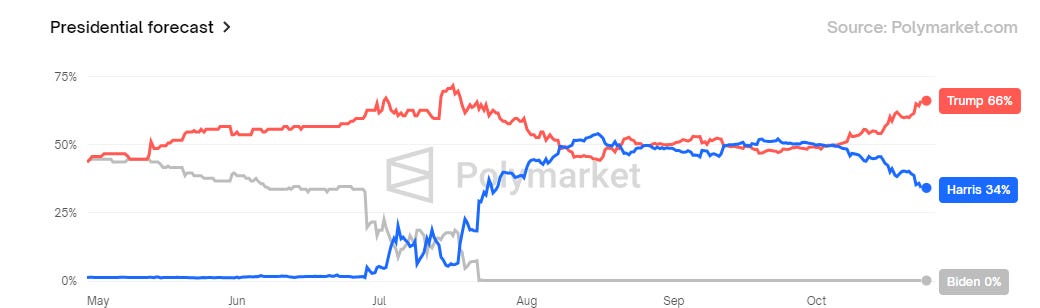
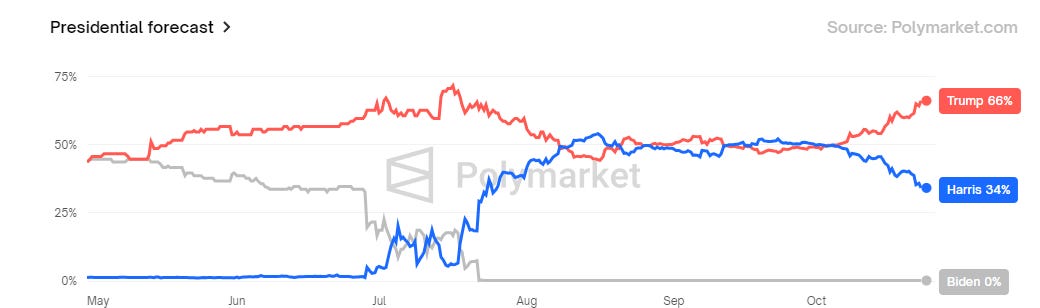
We have seen bonds sell off with rising Trump odds. However, we also believe that betting markets are currently pricing in near-peak odds of a Trump victory. As the election is close (poll spreads within standard error), we expect the Trump-Harris odds spread to narrow as we move towards election day. Investors have some time to modify their posture, but prudence is warranted.
What you need to know:
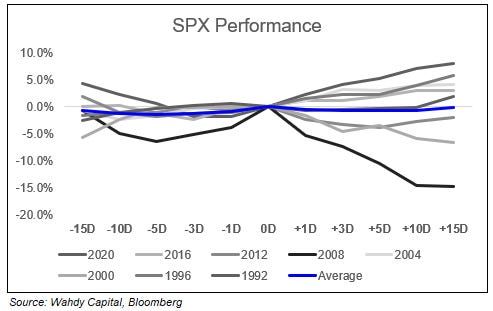
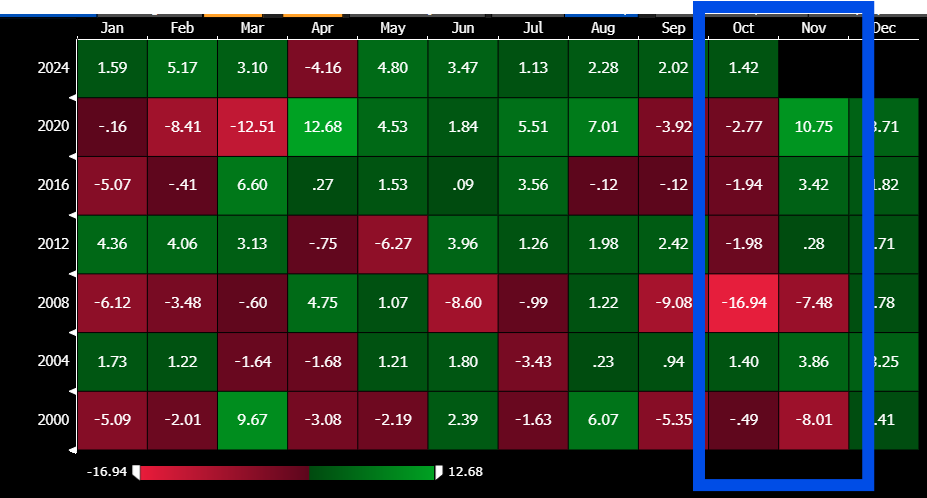
The S&P 500 Index has a degree of recurring volatility around the election. At the Index level, October tends to be weak into an election, with markets rebounding after the election takes place.
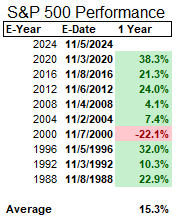
Who wins the election is less important for subsequent returns — since 1988, only the 2000 election saw a lower 1-year return for the S&P 500.
However, intra-market returns will vary greatly, driven by policy-induced sector rotation. The Wall Street Journal did a survey of economists to assess the potential impacts of a Trump or Harris presidency (read it here). Effectively, the differences are that:
Donald Trump’s policies of lower taxes, lower immigration, increased tariffs, and cutting social services seem to echo Nixon more than Reagan.
Kamala Harris’s policies of higher taxes, investment, agency expansion, and pro-immigration echo’s a mix of Obama and Clinton.
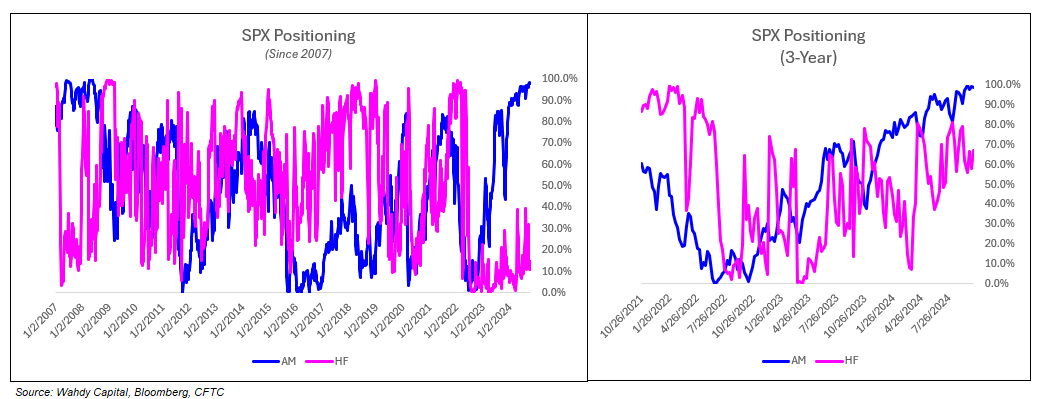
How is the market positioning for this?
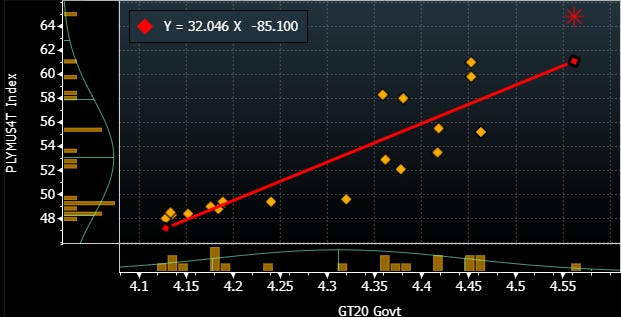
Trump is widely seen as being bad for bonds — JP Morgan estimates a 10% tariff would lift inflation by 1.5% and the 60% China tariff would add an additional 1.15%. This would imply a terminal nominal yield at 5%+, up from 3.4% in the Fed’s latest guidance, and represents significant risk to bond holders — similar to the bond reaction in 2022. Fun chart of how higher Polymarket (an elections betting website) Trump odds correlates to higher US bond yields:
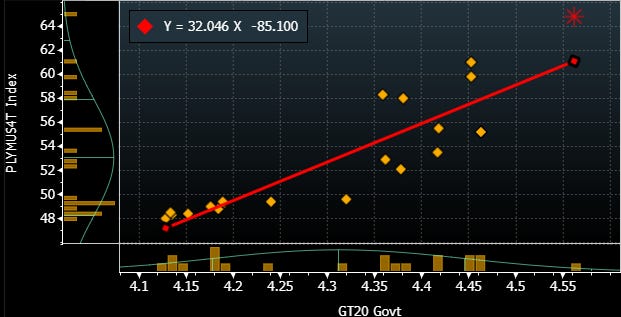
(Y-Axis= Polymarket, X-Axis = Yield on 20 Year bonds) Harris is seen as more of a continuation of the status quo in the economy, with a limited impact to the current path of interest rates and inflation. However, with bonds pricing in greater odds of a Trump victory, we expect a giveback of the election risk premia if the outcome turns for Harris.
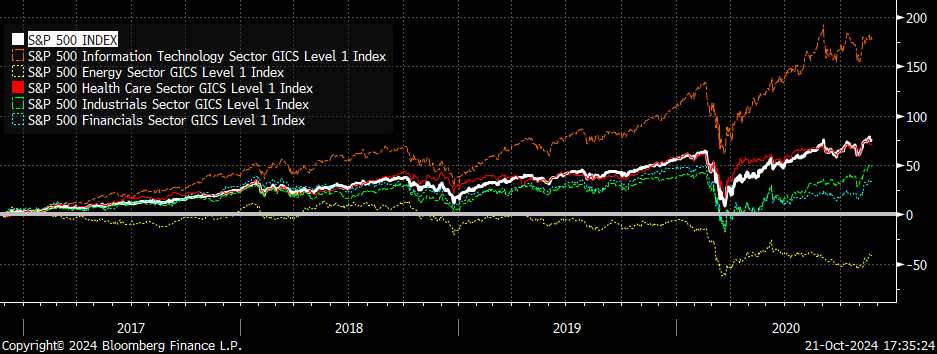
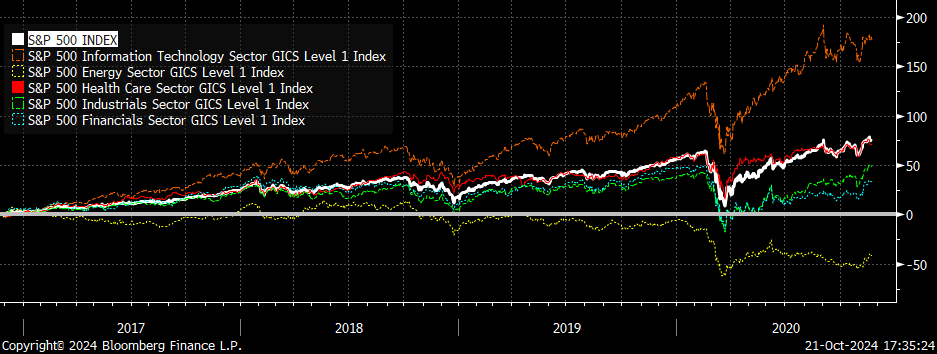
Equity performance under Donald Trump’s last term was largely similar to equity performance today — tech outperforming with industrials, energy, and financials underperforming:
How should investors position? Instead of trying to invest based upon who wins the election, we think a better approach is to invest more broadly and reduce non-systematic risk in passive portfolios. In equities, we would prefer domestic or global index ETFs like SPY, SPTM, or ACWI. In bonds, AGG and IAGG make sense, though Trump victory odds suggest it would be prudent to trim duration exposure.
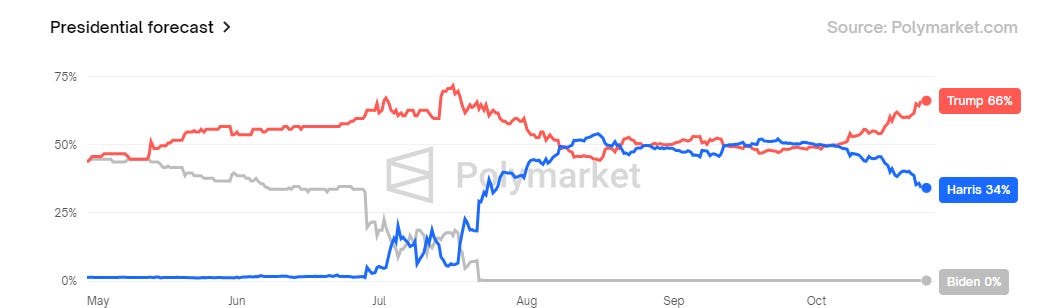
With that being said, Polymarket odds for Trump is near its peak. As the election is most likely a coinflip, we expect the Trump-Harris spread to narrow as we move towards election day:
A few charts to consider
Oct-Nov seasonality during election years:
1-year subsequent returns post-elections, since 1988:
Current SPX positioning: (AM = asset managers, HF = hedge funds)
Dispersion post-election: